General objective: To recognize and understand bar charts.
Specific objectives: At the end of this unit, you should be able to:
recognize different types of bar charts
understand the different functions and uses of bar charts
understand information conveyed in bar charts
make oral presentation of information contained in bar charts
INTRODUCTION ( Click here for dictionary )
Bar charts are generally useful for showing overall trends and comparisons. The most common ones are horizontal and vertical bar charts. The other types are multiple bar charts and subdivided bar charts.
1. Vertical Bar Chart ( Click to see Sample 1 and Sample 2 )
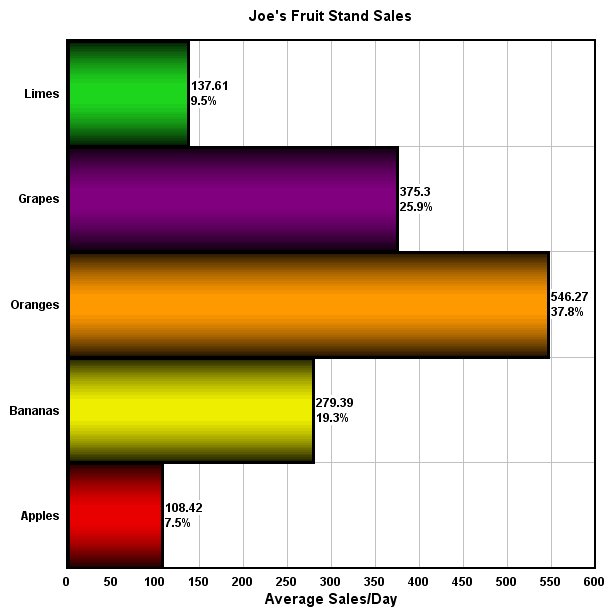
2. Horizontal Bar Chart ( Click to see Sample 1 and Sample 2 )
3. Multiple Bar Chart ( Click to see Sample 1 and Sample 2 )
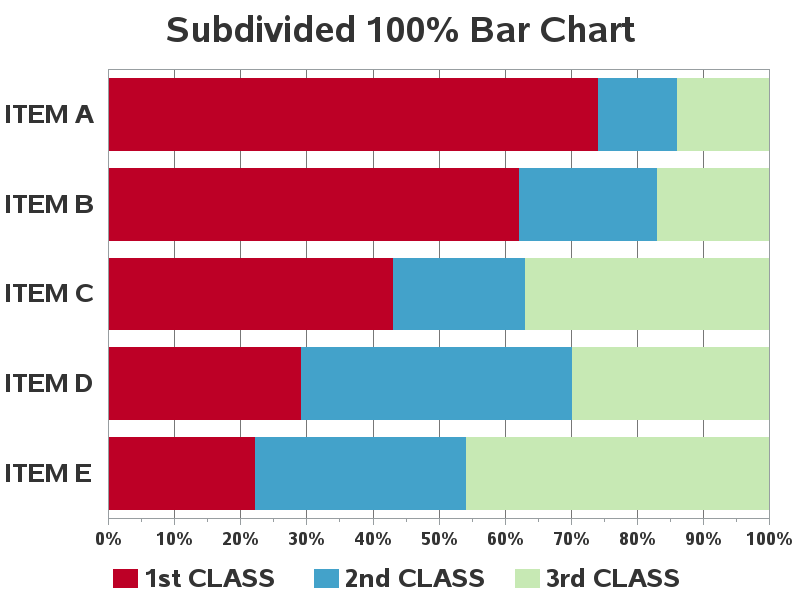
4. Subdivided Bar Chart ( Click to see Sample 1 and Sample 2)
Vertical and horizontal bar charts are useful in comparing differences in quantities. Multiple bar charts, on the other hand, make it possible to compare two or three variables within a single bar. If you need to show how different facts (components) contribute to a total figure, then the subdivided bar chart is desirable. A legend is provided in the multiple and subdivided bar chart as a key to the variables, facts or components.
For more information about bar charts, please click here.
This page has the following sub pages.
